Equity market quality in times of volatility

Back

2020 was an exceptional year in terms of volatility in Europe, reaching the levels of 2008 (measured by the CAC 40® Volatility Index or VCAC). Over the course of 2020 and 2021, volatility has remained higher than the average of the last five years.

As volatility increases, market quality deteriorates across all venues. However, analysis of this phenomenon is scarce, despite the fact that it is during highly volatile periods that market quality matters most for investors.

In this document, Euronext provides a short market quality analysis in order to tackle this lack of information, while opening the door for further research.

Euronext Equity Market Quality Analysis report

A short analysis, demonstrating that in times of heightened volatility, Euronext's equity market remains resilient and provides the best market quality for its listed stocks, and proving the benefits of Euronext’s liquidity schemes for investors. 

Executive Summary

  • Setting aside ‘black swan’ events such as March 2020, Euronext’s market quality remains resilient in periods of high levels of volatility compared to its main competitors.
  • The deterioration in some metrics is far less on Euronext than on other venues.
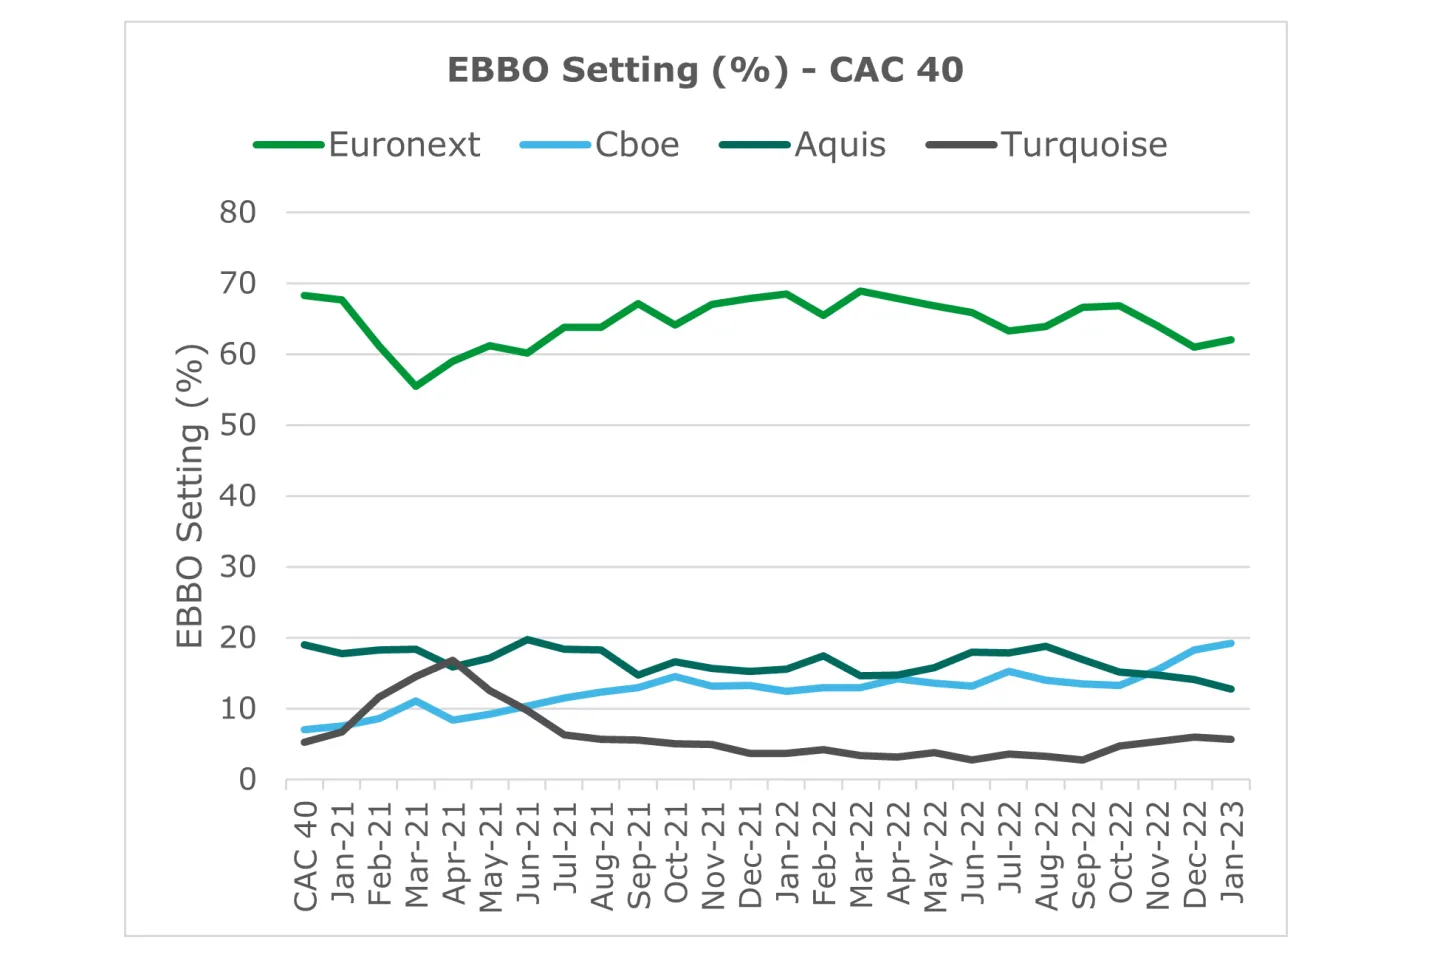
  • The impact of volatility on EBBO Presence and Setting is less noticeable on Euronext.
  • The analysis demonstrates the benefits of Euronext’s liquidity programmes and the importance of the requirements in place for clients.

Methodology

  • In this analysis, we select a basket of liquid securities that are listed on the Euronext Markets. The basket is made up of the component securities of the CAC40®, AEX® and BEL20®, the national blue-chip indices for France, the Netherlands and Belgium. By selecting these securities, we exclude the potential impact of illiquid securities. The data covers the period from 1 January 2020 to 9 September 2021.
  • The market quality metrics used in the study are provided by BMLL Technologies. Three main metrics are examined: Spread, Liquidity at Touch and Time Presence at the European Best Bid & Offer (EBBO).
  • The BMLL market quality metrics are then compared with the average annualised intraday volatility per security using the Garman-Klass volatility formula. Three buckets of volatility are identified, to take into account different market conditions.

Download Euronext market quality in times of volatility

Is the Equity Market becoming more resilient to global turmoil?

Back

The geopolitical tensions of 2022 are bringing back volatility to the markets.

Covid outbreak

The Covid outbreak in 2020 had already marked a turning point, with volatility at consistently higher levels than historically, translating into uncertainty over future expectations. From a microstructure standpoint, market quality is considered to be very sensitive to volatility: it is generally observed to deteriorate as volatility increases.

Ukraine and Russia

Nonetheless, based on empirical observations during the ongoing crisis between Ukraine and Russia, the overall equity market in Europe now seems to be more resilient to distortions driven by global events.

Market quality metrics

In this study, Euronext provides a short analysis comparing the market quality metrics in 2020 during the first wave of the Covid-19 outbreak and the recent market turmoil in 2022 caused by the Ukraine-Russia crisis.

Euronext Equity Market Quality Analysis report 

In this report, we observe that since early 2020, volatility and equity trading volumes have skyrocketed due to global markets turmoil, but European market quality appears to be more resilient to distortions during the Ukraine-Russia crisis in early 2022 than during the first Covid-19 wave in 2020.

During these recent geopolitical tensions, Euronext has maintained stronger metrics than MTFs in terms of average spreads and EBBO Presence/Setting. 

This testifies to Euronext’s resilient market quality, proving again its reliability even in times of unprecedented levels of volatility.

Executive summary

  • Since early 2020, volatility and equity trading volumes have skyrocketed due to global market turmoil, driven by the Covid-19 pandemic waves and the ongoing Ukraine-Russia crisis.

  • European market quality has been more resilient to distortions during the Ukraine-Russia crisis in early 2022 than during the first Covid-19 wave in 2020.

  • Even during the recent geopolitical tensions, Euronext has maintained stronger metrics than MTFs in terms of average spreads and EBBO Presence/Setting

Methodology

  • Market quality metrics are analysed for CAC 40® constituents, which are among the most liquid and highly traded securities on Euronext and at pan-European level. By selecting this subset, we exclude the potential impact of illiquid securities.
  • The data range covers two volatile periods: “First Covid wave” from 3 February 2020 to 30 April 2020, and “Ukraine-Russia crisis” from 3 January 2022 to 31 March 2022.
  • The red dotted lines in the charts highlight the relevant dates during the two periods: 16 March 2020, the day the first lockdown was announced in France, and 24 February 2022, the beginning of the Ukraine-Russia crisis.
  • Volatility is evaluated using the VSTOXX® Index (V2TX), which measures the volatility of the EURO STOXX 50 Index.
  • The market quality data in this study is sourced by the independent provider BMLL Technologies, and three metrics are analysed: Spread, European Best Bid & Offer (EBBO) Setting and EBBO Presence

Download Is the Equity Market becoming more resilient to global turmoil?

European grains market turmoil since 2022

Back

By Trend and Hedgeclub, Kyiv

trendhedgeclub.com

Falling agricultural commodities prices affecting the Black Sea region

Poland is one of the largest agricultural producers in Europe, with agriculture accounting for 3.8% of its GDP. However, local Polish farmers have been facing some difficulties due to falling prices of agricultural commodities undermining the profitability. This is affecting not only Poland, but the entire Black Sea region. Some claim that the price fall was due to flows of grains from Ukraine.

Poland and Hungary ban grain and food imports from Ukraine

In response, Polish farmers, along with their fellows from Slovakia, Bulgaria, Hungary and Romania, have been organising protests and strikes, demanding government support and higher prices for their crops, pushing the Polish Minister of Agriculture to resign on 5 April.  Some farmers have taken their protests a step further by blocking the import of Ukrainian grain. Several politicians asked Brussels to apply duties and quotas on Ukrainian grain, but not oilseeds and their by-products. Such moves pushed Poland and Hungary to ban grain and food imports from Ukraine on 15 April, followed by Slovakia introducing similar measures on 17 April. Meanwhile, Poland and Slovakia will continue to allow the transit of grains from Ukraine through their territories. 

Concerning reactions from the market

However, the reaction in the market has been controversial. There were concerns and accusations that some politicians in Poland try to manipulate public opinion, taking advantage of the current situation in the market, ahead of the parliamentary elections to be held later in the year. This has also raised concerns about protectionism and trade barriers.

The EU authorities have also criticised such unilateral actions by individual member states rather than having an EU-wide solution.

What is the actual impact of grain imports from Ukraine on prices?

"The amount of grain from Ukraine [via Polish borders] was not significant compared to the local crop. About 800,000 tons of wheat and 1,300,000 tons of corn have been imported to Poland since March 2022. This is not such a large amount," said Andriy Abdulov, a grain trader with the Polish company Agrolok. 

Volatile grain markets in 2022

“At the beginning of 2022, grain prices skyrocketed in the global market following the Russia’s aggression of Ukraine. Then, the prices started decreasing in March 2022 when Poland, Romania, Bulgaria, Hungary and the Baltic States decided to help Ukraine to facilitate transit of grains from Ukraine by land to final destinations as the major Ukrainian ports were blocked by the Russian navy. The grain prices kept falling on the international grains market following the creation of the "grain corridor" in July 2022 that partly restored grain shipments from Ukrainian ports,” Andriy Abdulov said.

The prices in the Polish grains market have followed the trend in the global grains market. At the same time, Poland had one of the best crops in recent years, adding pressure on prices in the local market. Exports of wheat and corn from Poland significantly exceeded the volumes of the previous years.

Petr Ciecwierz, advisor to trading company MK Merchants, also emphasises that grain prices have decreased throughout Europe, though they remain at pre-war levels.

Euronext MATIF Milling Wheat Futures trade levels

Thus, Euronext Milling Wheat Futures trade around the same levels as at the beginning of February 2022, and well above the 10-year average:

Euronext Matif - Euronext Milling Wheat Futures 10-year average

The narrative behind falling grain prices

However, politicians began to use the narrative about falling prices. "We will have elections this year. The situation in agricultural markets is used by certain political parties and agricultural unions to pressure the government and get more subsidies. Not only the government, but also the political forces that are currently in the opposition, repeat the same narrative," says Petr Ciecwierz.

Are Ukrainian exports impacting Polish grain prices?

"Actually, different media sources provide different information, different data. Some politicians say that we [Poland] need to export 9 million tons of grains [to bring the stocks to usual levels], others estimate this number at 4 million tons. No one even knows how many those reserves are. Therefore, it is not true that exports from Ukraine became the main factor affecting the drop in prices and the situation in Europe," says the market participant.

Influencing market sentiment about Ukrainian grain

The second false thesis of Polish farmers is about the poor quality of Ukrainian grain and the lack of checks at the border. Petr Ciecwierz notes that there is standard quality control at the border when it comes to the EU. All agricultural products are controlled according to European standards.

"The problem is Moscow propaganda. Because agricultural media and social networks, where farmers participate, spread false information. The thesis that the grain that comes from Ukraine passes without control for pesticides, mycotoxins, and the content of insects is not true. The government tried to explain the situation, but it was very limited. They tried to refute such information, but no one listened to them," says Petr Ciecwierz.

Polish farmers putting pressure on the government on grain prices

He also notes that Polish farmers are pressing the government to solve their problems, buy grains from them at prices above the current prices or influence the trading companies buying from farmers to increase the prices. This would be completely against a free market principle. 

Another problem: Poland cannot export its grains to a number of North African countries, for instance to Egypt, as Poland cannot provide appropriate certificates for export.

Managing price risk effectively with the Euronext MATIF grain contracts

One of the solutions for farmers would be to manage the price risk in a more effective way to protect themselves from unfavourable price movements. Using diverse hedging strategies, farmers can lock in their selling price to the levels that ensure profitability. For instance, Euronext MATIF Milling Wheat Futures dropped by about €20 between 1 March and 11 April while the drop was more than €70 since August when most wheat was harvested. If farmers fixed the price of their crop between August and March by selling futures, for instance, they would achieve significantly better performances.

By Trend and Hedgeclub, Kyiv

trendhedgeclub.com


This publication is for information purposes only and is not a recommendation to engage in investment activities. This publication is provided “as is” without representation or warranty of any kind. Whilst all reasonable care has been taken to ensure the accuracy of the content, Euronext does not guarantee its accuracy or completeness. Euronext will not be held liable for any loss or damages of any nature ensuing from using, trusting or acting on information provided. No information set out or referred to in this publication shall form the basis of any contract. The creation of rights and obligations in respect of financial products that are traded on the exchanges operated by Euronext’s subsidiaries shall depend solely on the applicable rules of the market operator. All proprietary rights and interest in or connected with this publication shall vest in Euronext. No part of it may be redistributed or reproduced in any form without the prior written permission of Euronext. Euronext refers to Euronext N.V. and its affiliates. Information regarding trademarks and intellectual property rights of Euronext is located at https://www.euronext.com/terms-use.

© 2023, Euronext N.V. - All rights reserved.

Virtualware lists on Euronext Access Paris

Equity Trading - April 2023

Back

Market quality analysis on Euronext remaining the venue for price formation in Europe.

We provide observations on Euronext’s superior price formation metrics compared to MTFs, with a focus on volumes and market quality during volatile weeks in March, and resiliency following the migration of Milan markets to Euronext’s Optiq technology platform.

Simon Gallagher, Head of Cash and Derivatives, Euronext

Highlights

  • Euronext Group volumes increased with recent volatility since mid-March:

    • Euronext Group Average Daily Value (ADV) traded increased by +43% up to €14.4bn during the period of 10 to 24 March.

    • €27.6bn was traded on Euronext equity markets on Friday 17 March, the third-highest historical record of volumes for the Group.

  • Euronext is by far the venue for price formation for Paris-listed stocks, even more significantly when volatility hits:

    • EBBO Setting on Euronext improved during mid-March volatility, from 61.7% to 68.5%, now 4-6x times higher than Cboe and Aquis.

    • Even when volatility normalised, EBBO Setting on Euronext remained +2.4% points higher than pre-volatility levels.

  • Euronext market quality for Milan-listed stocks improved with the recent volatility spikes, and even further after the migration to Euronext’s Optiq platform:

    • EBBO Setting climbed for Euronext from 49.1% before volatility spikes, to over 52% during March volatility, and then further to 57% since the Optiq migration. It is now 3.5x higher than Cboe and 2x higher than Aquis.

    • EBBO Presence: Euronext is now leading with 75.2% time Presence at EBBO, +10% points above MTFs.

Equity volumes and volatility

  • In 2023, before the volatility spikes of mid-March, Euronext Group Average Daily Value (ADV) traded was €10.1bn.
  • With the volatility uptick from 10 March 2023, Euronext Group turnover increased by +43% to €14.4bn Average Daily Value (ADV) traded.
  • €27.6bn was traded on Euronext markets on Friday 17 March, marking the third-highest historical record for the Group.
Equity volumes and volatility - April 2023


  Euronext Group
ADV traded (€bm)
VSTOXX
Volatility Index
Pre Volatility
2 January – 9 March 2023
€10.1 bn 18.9
During Volatility
10 – 24 March 2023
€14.4 bn 25.4
DELTA
vs Pre Volatility
+43% +6.5

Data source: Euronext Group. Volumes include Central Order Book and reported deals.

Market quality during volatile weeks of March - Paris

Euronext is the venue for price formation for Paris-listed stocks, even more significantly when volatility hits:

  • EBBO Setting on Euronext improved during mid-March volatility, from 61.7% to 68.5%, becoming 4x higher than Cboe and 6x higher than Aquis.
  • Even when volatility normalised towards end of March, EBBO Setting on Euronext remained +2.4% points higher than pre-volatility levels.
EBBO Setting (%) Euronext Cboe Aquis Turquoise
Pre Volatility
2 January – 9 March 2023
61.7 18.8 13.2 5.7
During Volatility
10 – 24 March 2023
68.5 15.4 11.6 4.1
DELTA
vs Pre Volatility
+6.8 -3.3 -1.6 -1.7
Post Volatility
25 March – 3 April 2023
64.1 17.8 11.9 4.8
DELTA
vs Pre Volatility
+2.4 -1.0 -1.3 -0.9
EBBO setting CAC 40 stocks - April 2023

Data source: BMLL Technologies

Such observations are consistent with market quality resiliency of Euronext in volatile periods over the last three years, as we have demonstrated with dedicated studies:

• Equity market quality in times of volatility | December 2021

Despite the volatility shock due to Covid waves in 2020 and 2021, Euronext displayed better Spreads, Liquidity at Touch and EBBO metrics compared to MTFs.

• Is the Equity market more resilient to global turmoil? | April 2022

European market quality was even more resilient during the Ukraine-Russia crisis in early 2022 than during the Covid waves in 2020. With volatility spikes during geopolitical tensions, Euronext maintained better EBBO Presence and Setting than MTFs.

Market quality following the migration to Optiq - Milan

Market quality and resiliency: Euronext market quality for Milan-listed stocks has been resilient to the recent volatility spikes and has improved sharply since the Optiq migration:

  • EBBO Setting climbed for Euronext from 49.1% before volatility spikes, to over 52% during volatility peaks.
  • EBBO Setting on Euronext increased to 57% since the Optiq migration. It is now 3.5x higher than Cboe and 2x higher than Aquis.
EBBO Setting (%) Euronext Cboe Aquis Turquoise
Pre Volatility
2 January – 9 March 2023
49.1 18.7 29.5 2.7
During Volatility
10 – 24 March
52.1 17.6 27.8 2.5
DELTA
vs Pre Volatility
+3.1 -1.2 -1.7 -0.2
Post Volatility
25 March – 3 April 2023
57.0 15.5 26.1 1.8
DELTA
vs Pre Volatility
+8.0 -3.2 -3.3 -0.9
EBBO Setting - weekly - FTSE MIB Securities - April 2023 32

Data source: BMLL Technologies

For more information

Equities team - Euronext

Do not hesitate to share with your sales representatives
any feedback or question that you might have.

Thank you!

Contact our team


This publication is for information purposes only and is not a recommendation to engage in investment activities. This publication is provided "as is" without representation or warranty of any kind. Whilst all reasonable care has been taken to ensure the accuracy of the content, Euronext does not guarantee its accuracy or completeness. Euronext will not be held liable for any loss or damages of any nature ensuing from using, trusting or acting on information provided. No information set out or referred to in this publication shall form the basis of any contract. The creation of rights and obligations in respect of financial products that are traded on the exchanges operated by Euronext's subsidiaries shall depend solely on the applicable rules of the market operator. All proprietary rights and interest in or connected with this publication shall vest in Euronext. No part of it may be redistributed or reproduced in any form without the prior written permission of Euronext.

Euronext refers to Euronext N.V. and its affiliates. Information regarding trademarks and intellectual property rights of Euronext is located at www.euronext.com/terms-use.

© 2023, Euronext N.V. - All rights reserved. 

Euronext NV | Beursplein 5, 1012 JW Amsterdam

Equity Trading - March 2023

Back

Factual insights on Euronext being the market where price formation happens.


We also provide observations on Closing Auctions activity, evolution of European equity volumes since 2021 with recent spikes over March, Euronext displaying the tightest spreads for Italian blue-chips, and discussions on the MiFIR Review.

Simon Gallagher, Head of Cash and Derivatives, Euronext

Highlights

  • EBBO Setting: Euronext is the venue where price formation happens with 62% EBBO Setting for CAC 40 and AEX stocks in February – at least 3 times higher than MTFs.

  • Trading at the Closing Auction: Euronext’s Head of Quant Research Paul Besson joined The TRADE’s Roundtable on Closing Auctions with Buy-side and Sell-side firms to discuss drivers, explicit/implicit costs, and impacts of growing volumes at the Close.

  • Equity volumes: Euronext is the largest exchange in Europe by Average Daily Value (ADV) traded for lit equities on-book, with €11.1bn ADV in February 2023. This is the highest monthly turnover since March 2022, and March 2023 is now experiencing significant spikes (€18.9bn on 15 March).

  • Average Spread on Milan blue-chipsEuronext displays lower spreads than MTFs, both at Touch (4.8 bps) and at Depth (5.5bps at 10K, 6.4bps at 25K).

  • Market structure and Regulation: Simon Gallagher, Head of Cash and Derivatives at Euronext, highlighted the relevance of regulatory scrutiny for Systematic Internalisers (SIs) and Payment for Order Flow (PFOF) in an article in The TRADE.

Topic of the month:

EBBO Setting and price formation

Euronext displays significantly higher EBBO Setting (%) than MTFs – meaning Euronext is the venue of price formation for the seven equity marketplaces we operate.

EBBO Setting and price formation - March 2023


EBBO Setting (%)

in February 2023
Euronext CBOE Aquis Turquoise
CAC 40 Stocks 62% 19.2% 12.7% 5.5%
AEX Stocks 62% 17.2% 15.5% 4.9%

Data source: BMLL Technologies

Roundtable on Closing Auctions

Listen to the Roundtable in four parts on Closing Auctions organised by The TRADE News where Euronext’s Head of Quant Research Paul Besson and other experts at Sell-Side and Buy-Side firms discuss.

Click on the four links below to watch the video:

  1. The key drivers of growth for rising volumes at the Close
  2. Implicit and explicit costs for trading at the Close in comparison with Continuous trading
  3. Impacts of the migration to the Close on the Continuous trading day
  4. How institutional investors can navigate these liquidity patterns

Auction volumes in percentage of total turnover across Euronext markets

Auction volumes in percentage of total turnover across Euronext markets - March 2023

Data source: Euronext Group

The Euronext Quantitative Research team published a research study back in 2021 highlighting the benefits of trading at the Close. It showed that for a given trade size, the resulting market impact during Closing Auctions is 2-3x smaller than it is for Continuous trading, as the Close represents the most liquid event in equity markets.
Feel free to request your copy of the report at QuantReports@euronext.com  

Equity volumes update

Euronext is the largest exchange in Europe by Average Daily Value (ADV) traded on lit equities with €11.1bn ADV in February 2023 - the highest level since March 2022.

Furthermore, the equity market is experiencing significant volumes spikes in March, with €18.9bn traded on 15 March – the trading day with highest turnover in 2023 YTD.

Euronext Equity trading ADV (€bn) per country

Euronext Equity trading ADV (€bn) per country

Data source: Euronext Group and IRESS Market Data

Market quality: average spread of Milan blue-chips

Euronext displays the lowest spreads on Milan blue-chips compared to MTFs – both for Spread at Touch (4.8 bps) and for Spread at Depth (5.5 bps at 10K depth; 6.4 bps at 25K depth).

JAN 2023 Euronext Aquis CBOE Turquoise
Spread at Touch 4.8 5.9 5.1 15.0
Spread at Depth (10K) 5.5 7.3 7.4 30.0
Spread at Depth (25K) 6.4 11.2 10.8 48.7

Spread at 10K Depth (in bps)*: Euronext better than Aquis and Cboe

Spread at 10K Depth (in bps)*: Euronext better than Aquis and Cboe

Data source: big xyt. Volume-Weighted Average Spread (VWAS) for 40 Milan blue-chips.

*Turquoise is not displayed in the chart.

Focus on Market structure and Regulation

As reported in The TRADE by Simon Gallagher, Euronext Head of Cash and Derivatives.

The City is defining the rules of Continental Europe more than ever post-Brexit

“The paradox behind the whole MiFIR Review is that the weight of the FCA and the City of London in European regulation has never been greater...

If regulators accept that Systematic Internalisers will form a material feature of the European execution landscape, then they should be regulated in a manner that reflects their scale, with reinforced transparency obligations and improved reporting on the nature of the trades that occur inside them.

The FCA has clear rules on Payment for Order Flow (PFOF) and we’re aligned with their view, whereas in Germany there is a toleration of the practice. As a pan-European operator, this lack of a joined-up, coherent vision of the markets is frustrating for us.

Check out the full article

Euronext Equities team at events in March

AFME Equities Dinner

9 March - The Savoy, London

Euronext sponsored the AFME Equities Dinner and was delighted to meet with honourable peers of the Equities industry during this annual tradition.

FIX Trading EMEA Conference

9 March - Old Billingsgate, London

On the panel ‘The Price of Liquidity in Equities’, Paul Besson pointed out that, in addition to the explicit trading fee, Markouts must be taken into account. Investors compare net trade prices versus the EBBO after the trade has happened; therefore, only looking at explicit fees is often misleading, as the rebate-paying venues also display the worst Markouts.

FIA Forum

9 March - Nasdaq, Stockholm

Italy Secondary Markets Update

13 March - Borsa Italiana, Milan

This Euronext conference was hosted in Milan with the local capital markets ecosystem, welcoming over 80 participants, and was the opportunity to share the framework of Euronext’s local and global initiatives across the value chain, amid the fast-changing landscape for Italian and European equity markets.

A variety of our experts discussed the evolution of trading (Massimo Giorgini) and clearing (Cristina Belloni) landscapes, Euronext’s superior equity market quality (Paul Besson), retail investors market structure (Roland Prevot) as well as the ongoing MIFIR review (Samantha Page).

Rosenblatt European Market Structure Conference

30 March - Royal Society of Chemistry, London

Listen to the keynote speech of Stéphane Boujnah and the panel with Simon Gallagher, and get in touch with  vboquillon@euronext.com  and  ngibney@euronext.com  to meet up at the event.

Check out our latest insights on LinkedIn

Click on the links below:

The TRADE Roundtable: Trading at the Closing Auction

'The Price of Liquidity in Equities' panel at FIX EMEA 2023

For more information

Equities team - Euronext

Do not hesitate to share with your sales representatives

any feedback or question that you might have.

Thank you!

EquitiesTeam@euronext.com


This publication is for information purposes only and is not a recommendation to engage in investment activities. This publication is provided "as is" without representation or warranty of any kind. Whilst all reasonable care has been taken to ensure the accuracy of the content, Euronext does not guarantee its accuracy or completeness. Euronext will not be held liable for any loss or damages of any nature ensuing from using, trusting or acting on information provided. No information set out or referred to in this publication shall form the basis of any contract. The creation of rights and obligations in respect of financial products that are traded on the exchanges operated by Euronext's subsidiaries shall depend solely on the applicable rules of the market operator. All proprietary rights and interest in or connected with this publication shall vest in Euronext. No part of it may be redistributed or reproduced in any form without the prior written permission of Euronext.

Euronext refers to Euronext N.V. and its affiliates. Information regarding trademarks and intellectual property rights of Euronext is located at www.euronext.com/terms-use.

© 2023, Euronext N.V. - All rights reserved. 

Euronext NV | Beursplein 5, 1012 JW Amsterdam

Florentaise lists on Euronext Growth Paris

R11683 - Associate Software Developer

Back

Submitted by Ariel on
Key accountabilities • Implement in coding the most complex components in new functionalities • Design performance critical subsystems • Produce clear and accurate documentation relative to implemented code • Work with other teams on overall trading system design • Contribute to projects addressing challenging subjects linked to new functionalities Your profile • Proficient in designing and developing with C++ using templates • Other programming languages expertise like Java and Python are a plus • Sound understanding of Linux operating systems • Strong problem-solving and analytical skills •

Euronext announces highest cash volumes in a year in March 2023

Euronext Thematic Index Solutions

Back

Why invest in thematic indices?

Thematic investing is an alternative to traditional investment, offering diversification and aiming to create long-term value on future trends.

New technologies are at the root of many thematic investments, providing early access to growth opportunities around the world before they become mainstream.

An investment strategy based on thematic indices offers investors a data-driven way to gain exposure to companies that match their interests.

As a leading index provider, Euronext aims to provide its clients with tools that expose them to this growing asset class while benefiting from high level operational and regulatory security.

Euronext Thematic Indices are to help investors identify companies that are actively implicated in a specific activity.

A sample of Euronext’s thematic indices


We are proud to present our new range of thematic indices that follow disruptive and secular growth themes including AI and Robotics, Technology, Wind and Solar, etc.

These indices target markets likely to grow faster than the global economy.

Euronext works closely with partners that prioritise high-quality data and granularity. Thematic indices go beyond traditional sector-based indices.

Euronext range of thematic indices includes:

Euronext indices are used by financial institutions all around the world with more than 15,000 ETFs, funds and derivatives associated to our indices with billions of AUM.

Learn more about Euronext thematic Indices

As a leading index provider in Europe for 40 years, Euronext has extensive expertise across a wide range of ESG and thematic indices, and is strongly engaged in supporting the financial sector’s sustainable transition. 


Contact us at index-team@euronext.com for any queries.


Back to previous page  I  Euronext Index Data Page  I  Euronext Index Team Services